Every year, hundreds of thousands of Americans go to the Emergency Room for various injuries resulting from common consumer products. Do you know how I know? Because the United States Consumer Product Safety Commission keeps track of them in a publicly available dataset.
The data is downloadable in Excel, but for exploration of the data, including summarizing, aggregating, and finding trends, our best friend is pandas, a data analysis library used with the Python programming language. Let me show you just how quick and easy it can be!
 |
| (No, not that panda). |
First, let's load the dataset into Python. There are two worksheets, which I've renamed and converted to CSVs for simplicity - "raw_data.csv", and "legend.csv".
import pandas as pd #import the library so we can use it
df1 = pd.read_csv("raw_data.csv") #load main dataset into a DataFrame
df2 = pd.read_csv("legend.csv") #load legend/keys into a separate DataFrame
We can quickly examine the data profile by using the describe() method (output shown is from a Jupyter notebook):

df1 = df1.drop(columns=['Other_Race', 'Other_Diagnosis',....])
We can see from the above data profile that most of our values are numeric, even for fields which we expect text, such as Body_Part or Sex. This tells me that we also need to examine the legend data to make sense of everything. We do so using another handy method, sample(), which shows a random sample of data rows:

So now how do we link the legend keys and the original values? In Excel this would be a VLOOKUP, or in SQL this would be a Left Join. To do it in pandas, we write the following:
#first, find the subset of "Product" keys in the legend
prod_legend = df2.loc[df2["Format_Code"]=="PROD"]
#now, merge it onto the main dataset
df4 = pd.merge(df1, prod_legend, how = 'left', left_on=["Product_1"], right_on = ["Key"])
---
Then, we look at the sample output:

Now that we have a clearer data set, we can explore different trends such as what products are most responsible for injuries. Looking at the first few rows above, however, I am very interested in the age of patients coming in. We can visualize this with a graph, and even compare male and female patients and their respective ages:

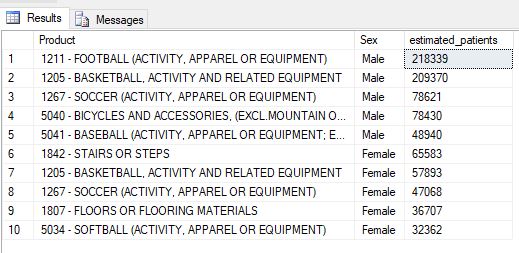
I expected to see more older people with injuries, but I guess I was wrong. But could we dig a little further into why "boys will be boys"? Checking out the top categories of injury for both men and women in the ages when men seem to outpace women in injuries, roughly around 10-20, shows sports, specifically football, as the culprit (output is from SQL):
Alright, but it's almost New Year's! What about fireworks? Just how much of a big deal are they?
Seems like even when you add up both ends of the graph (Jan 1 and Dec 31), the real danger is good old American pride
 |
| I would take a firework in the face for America, any day. |
May we all have a wonderful, COVID-free 2022!


