Thursday, December 30, 2021

Happy New Year and Don't Blow Yourself Up: Exploring National Injury Data with Python

Every year, hundreds of thousands of Americans go to the Emergency Room for various injuries resulting from common consumer products. Do you know how I know? Because the United States Consumer Product Safety Commission keeps track of them in a publicly available dataset

The data is downloadable in Excel, but for exploration of the data, including summarizing, aggregating, and finding trends, our best friend is pandas, a data analysis library used with the Python programming language. Let me show you just how quick and easy it can be!


(No, not that panda).


First, let's load the dataset into Python. There are two worksheets, which I've renamed and converted to CSVs for simplicity - "raw_data.csv", and "legend.csv". 


import pandas as pd #import the library so we can use it df1 = pd.read_csv("raw_data.csv") #load main dataset into a DataFrame df2 = pd.read_csv("legend.csv") #load legend/keys into a separate DataFrame
We can quickly examine the data profile by using the describe() method (output shown is from a Jupyter notebook):


We have a lot of columns (25, in fact). but I don't want to use all of them. Let's drop a couple with a simple command:

df1 = df1.drop(columns=['Other_Race', 'Other_Diagnosis',....])

We can see from the above data profile that most of our values are numeric, even for fields which we expect text, such as Body_Part or Sex. This tells me that we also need to examine the legend data to make sense of everything. We do so using another handy method, sample(), which shows a random sample of data rows:


So now how do we link the legend keys and the original values? In Excel this would be a VLOOKUP, or in SQL this would be a Left Join. To do it in pandas, we write the following:

#first, find the subset of "Product" keys in the legend
prod_legend = df2.loc[df2["Format_Code"]=="PROD"]
#now, merge it onto the main dataset
df4 = pd.merge(df1, prod_legend, how = 'left', left_on=["Product_1"], right_on = ["Key"])
---
Then, we look at the sample output:


Now that we have a clearer data set, we can explore different trends such as what products are most responsible for injuries. Looking at the first few rows above, however, I am very interested in the age of patients coming in. We can visualize this with a graph, and even compare male and female patients and their respective ages:


I expected to see more older people with injuries, but I guess I was wrong. But could we dig a little further into why "boys will be boys"?  Checking out the top categories of injury for both men and women in the ages when men seem to outpace women in injuries, roughly around 10-20, shows sports, specifically football, as the culprit (output is from SQL):


Alright, but it's almost New Year's! What about fireworks? Just how much of a big deal are they?
Seems like even when you add up both ends of the graph (Jan 1 and Dec 31), the real danger is good old American pride 


I would take a firework in the face for America, any day.


May we all have a wonderful, COVID-free 2022!


Sunday, June 30, 2019

What Makes a Great Women's Soccer Team? And Why The USWNT is a Statistical Anomaly

The continued success of the US Women's National Team (USWNT), coupled with the recent under-performance of the Men's National Team, is causing American soccer fans both joy and frustration. While our women's team is on a surefire path to another World Cup title, the men's team didn't even qualify for the last competition. This leads us to ask:

Is there a link between the strengths of a nation's male and female soccer teams? 


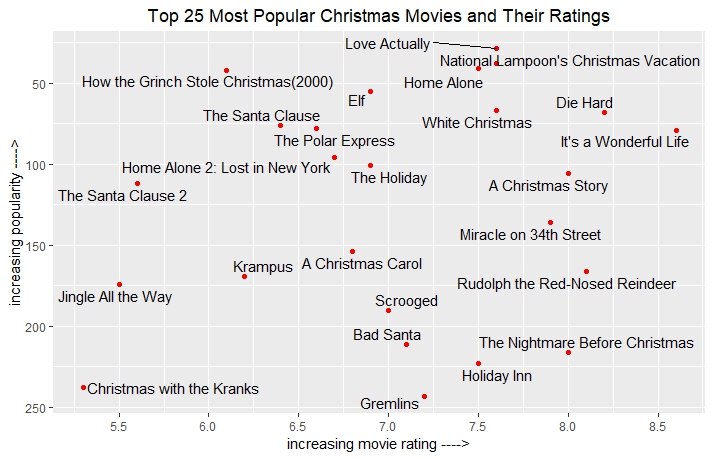
We can see that some countries such as France, Brazil, and England, for example, have top-ranked national teams for both genders. However, many other countries, especially those further down the rankings, may have a strong Women's team and only an average Men's team. The opposite may also be true for other countries. Here's a nice graph to illustrate:


If you draw a line from Aruba to France, you'll find good examples of the women's and men's rankings being similar for a particular national team. However, countries such as Canada or Uruguay are easily seen as outliers of this pattern.

So, what's causing what here?


Almost every country had a men's soccer team before a women's soccer team. In fact, there are many countries that still don't have a women's team. Therefore, it makes more sense to predict the strength of the women's team based on the men's team of the same country. As we saw in the graph, the relationship is there, but can we add other factors to more accurately predict the women's soccer team ranking?

The factors that might make a national soccer team great (total population, GDP per capita, popularity of the sport) are already captured within in the original metric - the FIFA World Rankings.When thinking of women's sports, however, it's easy to hypothesize that the countries in which gender equality is higher, women's sports is stronger. Also, while it's somewhat of a stereotype that lesbians are over-represented among female athletes, I think it's worth examining, especially after USA star Megan Rapinoe saying "you can't win without gay players." So, we'll investigate if there's a relationship between how LGBT-tolerant a country is to its performance on the women's soccer pitch.

Megan Rapinoe, a star for the USWNT, recently asserted that LGBT athletes contribute heavily to women's sports.

Data measures used for prediction:

2. The UN's Gender Inequality Index (We'll be using the inverse, which we'll call "equality score") - this is calculated from factors such as the proportion of women in government, women's status in the workplace, and reproductive healthcare availability. 
3. An LGBT rights score collected by Human Truth Foundation, a liberal think tank. It is calculated from factors including the legal status of gay marriage, discrimination protections, and levels of anti-gay hate crimes in a country. 
When we compare all of these against the FIFA Women's Ranking, we can see which of the three data measures contribute, and how much, to the projected strength of a women's soccer team.

Measuring accuracy using R^2 score: 

R^2, or R-squared, is a common statistical measure to describe how well a prediction, typically a best-fit line (linear regression) fits the data. Simply put, if two values are correlated, they'll have an R^2 score closer to 1. If they're not correlated, the R^2 score will be closer to 0. If we were trying to predict ice-cream sales as a function of how hot it is outside, our model might look like this


If we get the results on the left, then the correlation is very high, and a future prediction would be accurate. If we get the results on the right, then the correlation is fairly low, and a prediction is not accurate

For reference, here's how our three predictors match up:


Creating a model and evaluating the results

If we run a multiple regression (available on Excel) we can create a formula in the form y = m1x1 + m2x2 + m3x3 + b   to calculate our desired metric: the women's ranking score. If we normalize everything to a common scale (0-100 in this case), we get this equation:

Women's Team Score = 0.46*(Men's Team Score) + 0.22*(Gender Equality Score) + 0.28 (LGBT Rights Score) + 6.5

From the coefficients (0.46, 0.22, 0.28), we see that the Men's Team Score has the biggest impact of the three variables. The 0.46 coefficient can be read as "for one unit increase in the men's team score, the women's team score would be projected to increase by 0.46 points". This higher coefficient does *not* signify the prediction accuracy of the individual variable, only its relative strength in the model. 

The R-squared value for this combined formula is 0.61. By definition, this means that "61% of the result variable is explained by the predictor variables, and the rest due to other factors or natural variability"

I'll save you a fancy chart- using this prediction formula, the top 5 women's team would be:

1. Belgium
2. Netherlands
3. France
4. Denmark
5. Sweden

The United States:  A Statistical Anomaly

The USWNT is dead-set on bringing another World Cup home. They're the #1 ranked team in the world, however the men's team is only ranked #31. And while the US does rank high on LGBT rights - though not nearly as high as the Netherlands or Iceland, for example - the UN's Gender Equality score for our nation is actually surprisingly...average. If we followed our formula above, the USWNT would actually come in at #35 on the current Women's Rankings. Is the American secret to success great coaching? generational talent? or just big ol' dose of FREEDOM? Either way, our ladies in red, white, and blue are performing above mathematical expectations.

Predictions for countries that currently do not have a women's team

So we can estimate a score and test is versus a score that already exists. Neat, huh? But the real usefulness comes for predicting values which are still unknown. Here are five countries that do not have a women's team, or whose team is currently unranked due to inactivity. Using our formula, let's see how they'd rank, if they hypothetically had a team:


Other possible factors

So was our model good? Technically, yes. It's hard to get an R-squared score much higher than 0.6, especially in sociology. Otherwise, we'd already be able to forecast a lot more about social structures and behaviors. In practice, however, it's tempting to see this model as not much more than a rule of thumb. Is your men's team good? Do you care about women's and LGBT empowerment? Well yeehaw partner, you might have a good women's soccer team!

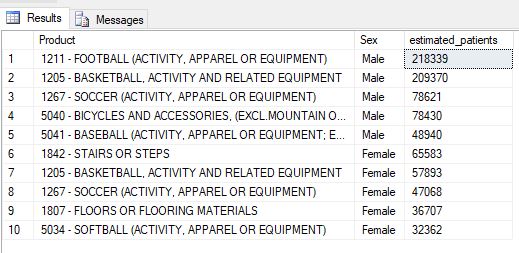
In future studies, there are other factors we could consider to improve our accuracy. For example, in most European and African countries, soccer is the #1 male sport and the #1 female sport in popularity. However, in the US, American football is the #1 male sport (basketball is #2), but soccer is the #1 female sport. The same goes for Australia and New Zealand, where men might play rugby, a sport not as widely participated in by the fair sex. It's no surprise then that the US, Australia, and New Zealand women's have been outperforming their male counterparts. Another potential consideration could be the average salary of male and female soccer players across. Many more different factors could be studied, some with surprising relationships, and some with none at all.

------------

I hope you've enjoyed reading. Go Team USA!


Friday, December 21, 2018

Attention: Your Favorite Christmas Movies Suck

Ho ho ho there! The holidays are upon us, and with vacation and family time comes the inevitable re-watching of Christmas favorites from our childhood and beyond. There's only one problem - most of these movies are on the bad side of mediocre, and I'm going to use data (gathered from IMDb) to prove it to you.

PS- my favorite Christmas movie is Bad Santa, if that tells you anything.

Reason #1: Too many Christmas movies are unfunny"comedies"

Looking at only the primary movie genre, and excluding rom-coms (which I'll get to later, yuck), over HALF of the top 100 or so Christmas movies are classified as 'Comedy'. I'm not laughing, though: 

                                                 
You might say - what's wrong with some good, clean, family fun? Well, you may have a point. But the numbers disagree with you. For posterity, here are the average ratings for the top movie categories:


Reason #2: Not nearly enough cursing, violence, or nudity


Almost all the top movies are rated G, PG, or PG-13, as show in the pie chart below. We need more R-rated films, and Die Hard (yes, it counts) is a great example of this: sure, it's nice when the main character reunites with their family in time for Christmas, but it's that much more memorable when they blow stuff up along the way.


Reason #3: The most popular movies aren't necessarily good ones


The following scatterplot shows the most popular Christmas movies and if their popularity (measured by IMDb's traffic) has any correlation to how good they were rated by viewers. Spoiler alert: the correlation is weaker than a snowman in May.


Sure, some popular movies are also good. But if you actually enjoyed The Santa Clause 2, you should probably keep waiting for Easter to come around, because you need Jesus.


Reason #4: They haven't made a good one in years

I'll use a simple table to illustrate this - here are the top 25 Christmas movies by rating, with their release year. Notice anything? There are exactly 4 movies made after the year 2000. The last broad-release Christmas movie to feature in the top 100 is 2015's The Night Before (yes, the one with Seth Rogen) which earned a whopping 6.4 rating, so let's all reflect on how Hollywood has continually failed us.


Reason #5: Would it kill you to have some damn culture?

Sure, America has always dominated the holiday movie industry. But Christmas is celebrated worldwide, and while we do have some Canadian (Silent Night, Black Christmas) and British films (Love Actually,  A Christmas Carol ), these are still all in English. Here are the few non-English movies I could find that register a blip on IMDb:

- The Disappearance of Haruhi Suzumiya (Japan, 2010)
- Joyeux Noel (France, 2005)
- A Christmas Tale (France, 2008)

Reason #6: The best Christmas movies aren't even released on Christmas!

Although the vast majority of Christmas movies are released during November and December, none of the top favorites were released on Christmas Day itself (see the chart).


Imagine, you've spent the entire day with family, and all you want is to see the latest & greatest Christmas film in theaters. But what kind of movies are  released on Dec 25? That honor is reserved for lame money-grabbing flicks like Marley & Me, Catch Me If You Can, and As Good As It Gets. The end result of this being that you end up seeing the same November-release Christmas movie you've seen with your 5-year-old nephew 3 times already in the past month. BORING!


Reason #7: This actually exists


We're so bad at making real-life Christmas movies that we have to resort to milking holiday cheer from an always-grumpy OGRE, his ogre wife, their ogre baby (what?) and the sound of Eddie Murphy's career dying. I rest my case.


Tuesday, December 12, 2017

Don't be alone this Hanukkah! - a handy guide on the names of Jewish singles

It was one of those rare times I joined my friends at a bar in downtown Fort Lauderdale. After several dances with an especially attractive woman, my friend returns to our table, dejected.

"Not Jewish," he says.
"How do you know? Did you ask?" I reply
"Of course not! You can't do that," he retorted. "Anyway, her name is Tiffany. Have you ever met a Jewish woman named Tiffany?"
"Also, she's blonde." my other friend added thoughtfully.

Frequency of names always fascinated me. For better or worse, I was always the only Yoav in school, or even the entire world for all I knew. On the flip side, most of us have more than one friend named David, John, Ashley, Lauren, or Miguel. The Social Security Administration tracks names for babies born each year, and many data scientists have used this readily available information to note trends for certain names and decades. But, where can we find information specifically about Jewish names?

I'm glad you asked. The answer is JSwipe, a popular dating application for Jews. In what was no small feat, I manually collected the names of 1000 Jewish men and 1000 Jewish women (yes, there are at least this many gefilte fish in the sea), aged 18-40, in the South Florida area - from West Palm Beach to Boca Raton to Miami. I also noted the ethnicity of users, either by name origin or other profile details. Get ready to swipe right on my findings:

1. The top female Jewish name is Jessica. For men, Michael and David are tied at #1

The bar graph I constructed shows the top 20 names for both genders:


2. Israeli Men Really Need Your Love

While going through profiles, I noticed a definite peculiarity: there are almost twice as many Israeli men on the app than there are Israeli women. If you're a woman looking for men on JSwipe (or rather, having men aggressively look for you), there's a 1 in 7 chance you're swiping on an Israeli, with the most common names being Tal, Avi, and Yossi. If you're a man looking for women, about 1 in 13 are Israeli, with the most common name being Yael

While American followed by Israeli names were by far the most common, I also identified three other distinct groups of name origin: Latin (from Brazil and Spanish speaking countries), Russian and Eastern European, and Ashkenazi Orthodox (Hebrew names that are not popular in modern Israel, such as Bracha or Mendel). The breakdown is represented in these two graphs: 


3. Men's names are slightly more top-heavy, and women have more unique names

Out of 1000 people, there were 417 unique names for women, and only 324 for men. The fact that there are seemingly "less" male names corresponds with the finding that, compared to women, the top 10 male names are more common (taking up 27% of all male names) than the top 10 female names (which constitute 22% of all female names):

Men:
 Women:


This means that by yelling "hey David, Michael, Daniel!" into a synagogue of 100 men, you should expect an average of 11 people to turn around. In fact, according to the binomial distribution, there's a 99.9% chance that at least 3 people will answer.

For women, however, you might have to shout one more name to achieve the same feedback, and this disparity grows the more names you try to guess.

update: after discussion of these findings, I've had it pointed out to me that male names tend to be more traditional (and often biblical) as opposed to female names (of which there are less in the Bible), which change more quickly and are more likely to be considered "modern". This is certainly an interesting observation.

4. There are too many Bretts

Seriously. I had to swipe through 11 Bretts? Yeesh. 


5. It's interesting to compare Jewish names against the general population

Which names are more Jewish? Which names are less Jewish? I've analyzed data from the general population against the Jswipe data set to find this out. Here's a graphical summary of selected names:


And there you have it.

----

I hope all of you have an extremely happy and joyful Hanukkah. And to my non-Jewish friends, which almost certainly include one Tiffany who danced with us at Rhythm & Vine last week, I'd like to wish a Merry Christmas and a Happy New Year.

Yours,
Yoav

Wednesday, June 7, 2017

It's Always Sunny in Miami, and Not So Much in Boston

My old roommate and I were involved in a vicious feud. You see, he liked to open the windows when it was warm out; however, he always neglected to go back and close them when it inevitably got cold again. This resulted in me shivering for a few hours before I realize that, while it was 75 degrees only a day ago, it's now 55 degrees and I should really put on some pants.

 The essence of the problem can be described in visual form:


This is a common problem for anyone who's lived in New England, where any Uber trip between April and June is likely to involve complaints about the weather. 

Just how common is this problem? I set out to find just how fickle the daily temperature is among the top 25 US cities. In choosing these cities, I used a combination of metrics: population, GDP, and net migration. The analysis was done using the statistical software R, with weather records from Weather Underground. (For a more detailed, technical view of how I worked with the data, click here)

I first set out to find the variance of the weather for these cities as a measure of volatility. I used daily high temperature data for all 366 days of 2016 (a leap year). I ranked the cities by their temperature variance, in descending order, below:


But what does this really mean? Variance is defined as the squared sum of deviation from the mean. In other words, a high variance in this context would mean that a city has many days in which the temperature is much different than the average temperature for the entire year. This could mean many days of ping-pong hot and cold weather, or simply a very pronounced changing of the seasons. Let's look at a temperature graph of a few selected cities. I've ordered them from high to low variance:


We see that cities with high variance, such as Minneapolis and Denver, have temperatures that reach a wide range throughout the year, and while there's a definite pattern (cold winter, warm summer), there are still sharp week-to-week and sometimes day-to-day changes - see Boston's dip to a high of about 60 degrees in July and then a jump to the 90s a week after. On the flip side, cities with extremely low variance such as Miami and San Francisco have much flatter, lower-amplitude graphs. Amazingly, Miami's daily high temperature hovers between 72 and 92 degrees Fahrenheit a full 90% of the year!

This doesn't fully answer my original question - in which cities are you most likely to experience the frustration of making a completely new daily evaluation of your window openings, how many layers to wear, and whether or not to finally put away your winter clothes for good? To answer this, I've calculated the temperature swings of each day over the previous day. I've chosen a difference of +/- 10 degrees as an arbitrary metric for "pain-in-the-butt-weather". Let's see the results:


So, almost every third day in Boston seems to be a jump in temperature. However, in Miami, you can paint a pretty accurate weather forecast of tomorrow if you've been outside today. I guess now we know why Pitbull is so happy.

PS -I also calculated the number of days in a year with a 20+ degree temperature swings. Denver leads with 21, but almost all cities have 10 or less of these days (Miami and San Francisco have 0). So, if you wake up one morning and it's 20 degrees colder or hotter than the day before, do note that this is pretty rare, and therefore definitely merits complaining (I'll be here to listen!)


Tuesday, April 28, 2015

Are You Smarter Than a Rhode Islander? Analyzing Jeopardy! Data

Jeopardy! is an American trivia game show that has been running for over 30 seasons now. When it comes to game shows, it is a true battle of the brains: contestants have few seconds to answer difficult questions spanning from Greek mythology to Shakespeare to sports and entertainment.

Jeopardy! promo containing its infamous host, Alex Trebek


So what makes a good Jeopardy! player? If you had to choose the perfect contestant in order to win, say, a bet with your friends about the outcome of the next show, who or what would you choose? To replace such thoughts with hard numbers, I dove into historical data on the past 31 seasons of Jeopardy!:

Step 1: Find and extract data
Luckily, a dedicated fan-run website keeps meticulous tabs each show, including the contestants (name, origin, and occupation), the scores at the end of each round, and even the questions themselves. Copying and pasting this would be a chore even an unpaid intern couldn't finish. To speedily extract the information, i used import.io , an incredibly intelligent tool which can scrape data requested by the user over multiple pages automatically

Step 2: Cleaning the data
The fans aren't getting paid to do this, so naturally they missed a show here and there, or cut off a contestant's name or hometown. What do you do with empty or null values? What about data from different show variations such Teen Jeopardy! or Jeopardy! Kids Edition? My point is, data isn't perfect, and we have to make some choices about how to prune the bonsai tree of possible outliers.

Step 3: Asking questions
There are numerous potential variables which may determine a good contestant, but our choices are limited to the data collected. Interesting variables to consider which are currently untracked may be age, sex, or income, for example. I chose to separate Jeopardy! contestants by two factors: state of residence and occupation.

Step 4: Presenting data visually
So, does a state determine whether or not you'll be a winner? Let's take a look at these graphics, which I created using Tableau:


Figure 1: Average Jeopardy! score by contestant's state

It's quite easy to see Utah emerge as the top performer among the show's contestants. That may not be a fair comparison, considering that a huge majority of those data points came from one person - Ken Jennings, a teacher from Salt Lake City who strung together 74 consecutive wins. However, we can see color-coded data on the average score from each state. Note that the overall average winnings for a contestant on Jeopardy! is about $9500.

Let's explore another two charts:

Figure 2: Winning ratio for contestants from a given state


In this graphic, deep red color indicates a low chance of winning. The hypothetical chance for each contestant is 1/3, or 0.333, and you'll see only slight variation among most states. However, Utah again comes up ahead with a 78% chance to win(!), while a contestant hailing from Rhode Island has only a 15% chance to win, less than half the theoretical possibility. Is something in the water over there?

For completeness, we'll show a heat map of where Jeopardy! contestants come from. Counting repeat appearances, there have been over 12,000 guests on the show. 
Figure 3: Geographical frequency distribution of contestants
Unsurprisingly, there are large clusters of contestants from major US metro areas such as Los Angeles, New York, and Washington DC. It should be noted that the number of contestants in Utah and Rhode Island are relatively small (100 and 47, respectively, compared to over 2000 in California and 1200 in New York), but still relevant enough to draw conclusions, depending on the degree of confidence we want. Interestingly, the Law of Large Numbers seems to hold here: states with larger contestant populations approach the theoretical mark mentioned before of a 0.333 chance of winning. 


Lastly, I've identified a few major categories which have comprised the occupations listed for Jeopardy! contestants over the years. The average score for each as well as the count of appearances is listed below:

Figure 4: Average contestant winnings by occupation group. The number of contestants is labeled to the right of the bar.


Students and engineers at the top, managers and moms at the bottom. Is this what you expected? What other metrics do you think would be good for comparing Jeopardy! performance?

In any case, I hope you've enjoyed reading, and I really, really hope you're smarter than a Rhode Islander.

--
Tech notes: for those interested, I have the data files available for sharing in both .mdf (SQL Server) and .xlsx (Excel)

Tuesday, September 2, 2014

Brute-force: introduction to hacking

In late August of 2014, a large set of celebrity information was hacked, with the most "newsworthy" material being nude or explicit photos. Per this article, the security hole existed in Apple's iCloud (specifically, the Find My iPhone feature) which allowed potential hackers to use "brute-force" attacks to gain entry to user accounts.

So, what is brute-force? Stated simply, if you are trying to open a numerical combination lock with 4 digits (0-9 making up 10 possibilities) and you don't know the code, you can try any combination until it opens: 1111, 2918, 3345, etc
The number of possibilities, by using the concept of permutations, is 10*10*10*10 = 10^4 = 10,000
Meaning that given enough time and finger strength, you WILL break the code in 10,000 tries or less (5000 on average).
Brute-force hacking is the most simple form of hacking there is, and usually takes the longest. Other methodologies may or may not be detailed in the future.

10,000 tries is quite a lot - which is why bike thieves usually use a hammer instead


If this code were a digital password, one could use a computer program or internet script to automatically input the 10,000 different combinations to gain access to the protected content. A computer, being much more powerful and fast than the average typing human, could knock this task out in a few hours (a maximum of 10,000 seconds or about 2 hrs and 45 mins), if we assume 1 second per try. However, per Wikipedia, good "cracking" programs can submit attempted passwords at a rate of 100+ million per second.

Consider most websites which require you to have a password of a minimum of 8 characters, using lowercase (26), uppercase (26), digits (10) and special characters such as % ^ & @ * etc (let's say 15 - it can vary per website). Note that this is assuming the English/Latin language alphabet base. The amount of password combinations for a password of exactly 8 characters is thus:

(26+26+10+15)^8 = 1.2 x 10^15 combinations. Dividing by 100 million, or 1x10^8 =
1.2 x 10^7 seconds to break the combination = 143 days. This number further increases if you have the option of using 9, 10, 11 etc characters. Likewise, if you limit yourself to only 8 lowercase letters and no digits or special symbols, your password will take 35 minutes to crack, given that the program attempts only lowercase letters first. This underscores the need for a "strong password".

So does this mean every password can be hacked given enough time? Well, yes. But, like your normal phone screen lock, trying too many wrong passwords results in the user being locked out from trying again - an important security feature. Unfortunately, this feature was neglected in just ONE Apple application which required a sign-in. So, given a celebrity's AppleID (usernames and email address are not exactly private most of the time), the hackers went to work.

So, what have we learned here?
1. Buy Android
2. Use strong passwords
3. Read my blog

(See - Apple's rebuttal)

Happy New Year and Don't Blow Yourself Up: Exploring National Injury Data with Python

Every year, hundreds of thousands of Americans go to the Emergency Room for various injuries resulting from common consumer products. Do you...